
推荐学习书目 Learn Python the Hard Way Python Sites PyPI - Python Package Index http://diveintopython.org/toc/index.html Pocoo 值得关注的项目 PyPy Celery Jinja2 Read the Docs gevent pyenv virtualenv Stackless Python Beautiful Soup 结巴中文分词 Green Unicorn Sentry Shovel Pyflakes pytest Python 编程 pep8 Checker Styles PEP 8 Google Python Style Guide Code Style from The Hitchhiker's Guide

这是一个创建于 2659 天前的主题,其中的信息可能已经有所发展或是发生改变。
代码如下
import matplotlib.pyplot as plt import numpy as np x = [1,5,30,200] y = [27,12,7,5] x = np.array(x) y = np.array(y) # x = np.arange(1, 17, 1) # y = np.array([4.00, 6.40, 8.00, 8.80, 9.22, 9.50, 9.70, 9.86, 10.00, 10.20, 10.32, 10.42, 10.50, 10.55, 10.58, 10.60]) z1 = np.polyfit(x, y, 3)#用 3 次多项式拟合 p1 = np.poly1d(z1) print(p1) #在屏幕上打印拟合多项式 yvals=p1(x)#也可以使用 yvals=np.polyval(z1,x) plot1=plt.plot(x, y, '*',label='original values') plot2=plt.plot(x, yvals, 'r',label='polyfit values') plt.xlabel('x axis') plt.ylabel('y axis') plt.legend(loc=1)#指定 legend 的位置,读者可以自己 help 它的用法 plt.title('polyfitting') plt.show() 使用插值拟合后,产生一个波峰一个波谷,我只想要个平滑的曲线,不知道有啥好办法
fq1 = interp1d(x, y1, kind='quadratic') fq2 = interp1d(x, y2, kind='zero') 下面代码是一个粘度曲线测试程序,请参考程序运行结果
import numpy as np from scipy.interpolate import interp1d #创建待插值的数据 # x = np.linspace(0, 10*np.pi, 20) # y = np.cos(x) x = [1,5,30,200] # x = [1,100,150,200] y = [27,12,7,5] x = np.array(x) y = np.array([27,12,7,5]) # 分别用 linear 和 quadratic 插值 fl = interp1d(x, y, kind='linear') fq = interp1d(x, y, kind='quadratic') #设置 x 的最大值和最小值以防止插值数据越界 xint = np.linspace(x.max(), x.min(), 200) y1 = np.array([21.350,11,6.62,5.05]) y2 = np.array([15.630,8.31,5.18,3.53]) # x1 = np.array([50,150,200]) # xint1 = np.linspace(x1.min(), x1.max(), 110) yintl = fl(xint) yintq = fq(xint) fq1 = interp1d(x, y1, kind='quadratic') fq2 = interp1d(x, y2, kind='zero') import pylab as pl fig, ax = pl.subplots() # make ticks and tick labels # xticks = range(min(x), max(x) + 1, 3) # xticks = range(1, 200 + 50,30) xticklabels = [1,3,10,"",30,100,200] # #设置网格样式 # ax.set_xticks(xticks) ax.set_xticklabels(xticklabels, rotation=0) ax.grid(True, linestyle='-.',color="b") yfq2=fq2(xint) yfq1=fq1(xint) # pl.plot(xint,fl(xint), color="green", label = "Linear") pl.plot(xint,fq(xint), color="red", label ="Quadratic") pl.plot(xint,yfq1, "b--", label ="QuadraticL") pl.plot(xint,yfq2, color="green", label ="QuadraticH") x3= np.array([1,5,30,200]) y3 = np.array([27,12,7,5]) pl.plot(x3,y3,"b-", label ="QuadraticZ") pl.legend(loc = "best") pl.ylim(1,50,10) pl.xlim(0,200,70) pl.show()  | 1 qile1 2018-07-01 21:57:03 +08:00 via Android 没人知道?写个函数计算是不是可以实现 |
 | 2 babywhiper 2018-07-02 01:40:27 +08:00 ```python import matplotlib.pyplot as plt import numpy as np x = np.array([1,5,30,200]) y = np.array([27,12,7,5]) plot1=plt.plot(x, y, 'x',label='original values') # calculate polynomial z = np.polyfit(x, y, 2) f = np.poly1d(z) x_new = np.linspace(x[0], x[-1], 200) y_new = f(x_new) plot2=plt.plot(x_new, y_new, 'r',label='polyfit values') plt.show() ``` 都拿到 3 元函数了, 那就是画图的问题, 多取几个点就好了. --- 但是拟合的曲线会有 overfitting 的问题, 不知道怎么解决.  |
 | 3 Ballacuda 2018-07-03 02:11:11 +08:00 |
 | 4 qile11 OP @daya0576 @Ballacuda 感谢回复,可能我方向不对,我画的是黏度曲线,不可能出现负数,上面画出来的都有负数, [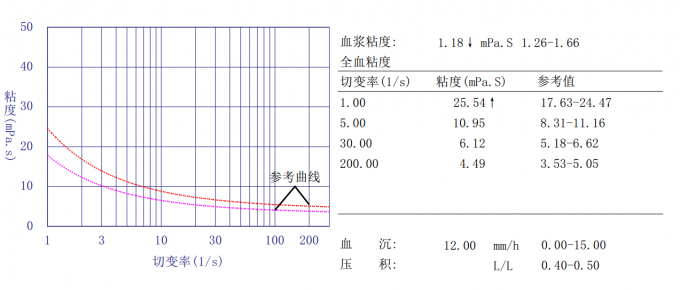]( https://imgchr.com/i/PE2kbF) [img]https://s1.ax1x.com/2018/07/03/PE2kbF.png[/img] |