

这是一个创建于 3214 天前的主题,其中的信息可能已经有所发展或是发生改变。
wxapp-charts
微信小程序图表 charts 组件
Usage
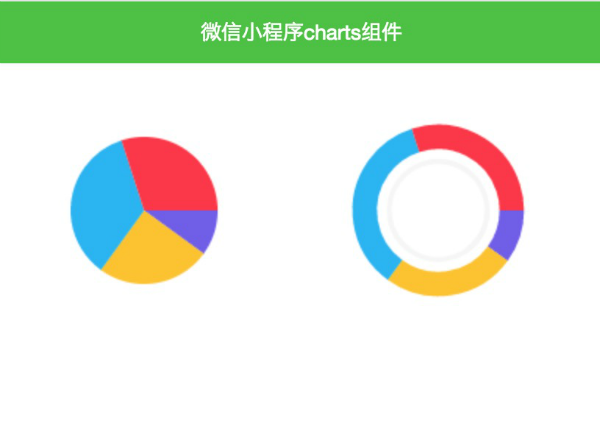
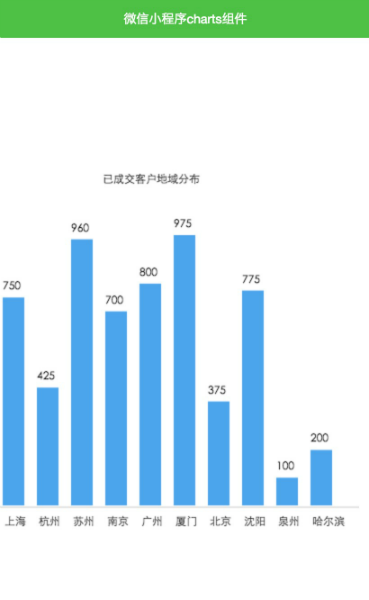
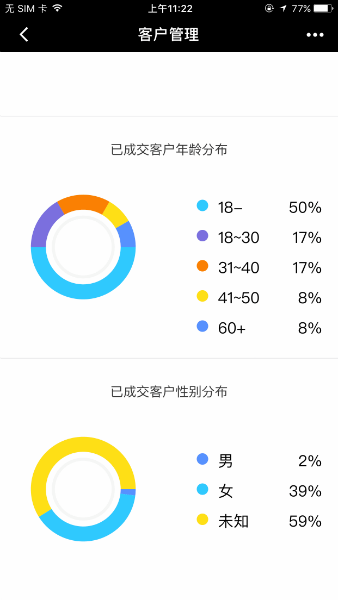
data: { charts: { area: ["上海,750","杭州,425","苏州,960","南京,700","广州,800","厦门,975","北京,375","沈阳,775","泉州,100","哈尔滨,200"], pieData: [10, 25, 35, 30] } } //饼图 new Charts({ type: "pie", data: this.data.charts.pieData, colors: ["#7158ec", "#fec312", "#1db2f4", "#ff3444"], canvasId: 'canvas1', point: { x: 150, y: 150 }, radius : 100 }); //圆环图 new Charts({ type: "ring", data: [10, 25, 35, 30], colors: ["#7158ec", "#fec312", "#1db2f4", "#ff3444"], canvasId: 'canvas2', point: { x: 150, y: 150 }, radius : 100 }); //柱状图 new Charts({ type: 'bar', data: this.data.charts.area, bgColors: "#46a2ef", color: '#383838', cHeight: 300,//表格高度 cWidth: 500,//表格宽度 bWidth: 22,//柱子宽度 bMargin: 16,//柱子间距 showYAxis: false,//是否显示 Y 轴 xCaption: 'x 轴说明文字', yCaption: 'y 轴说明文字', canvasId: 'chartContainer' }); 参数说明
type: -支持 pie,ring,bar data: [] colors : []颜色 canvasId: canvas-id point:x 轴圆心坐标,y 轴圆心坐标 radius :半径大小 xCaption: 水平坐标说明文字 yCaption : 纵坐标说明文字 showYAxis :是否显示 y 轴 更新说明
- 增加 data 对外接口
- 添加部分 API ,如 cWidth 等
效果如图所示

下载地址:图标 charts 组件下载
目前尚无回复